Here’s your next tidbit of information when the subject of our current deep-freeze weather pattern comes up in conversation.
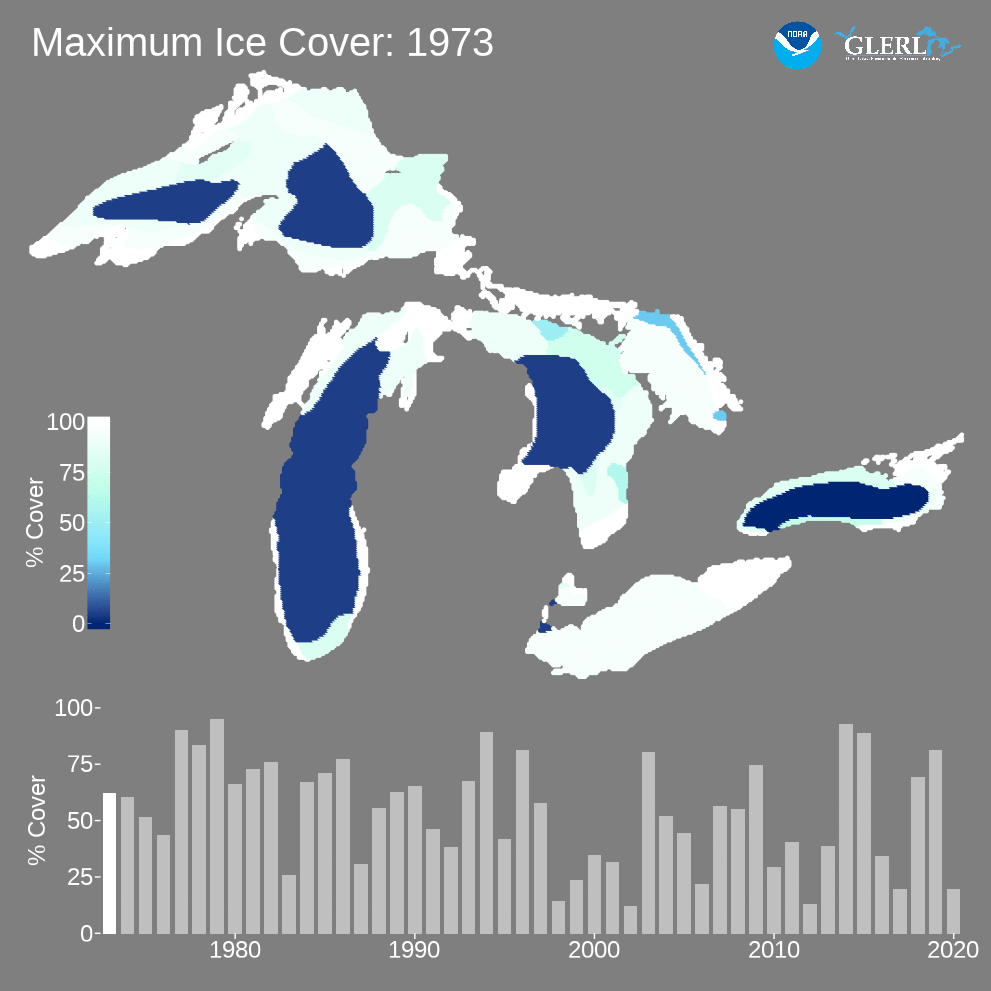
To your coworker(s): “Did you know that in spite of the brutal cold, 2017 was a relatively low year for Great Lake ice coverage at less than twenty-five percent?” (Take a swig from your water bottle while this sinks in)


The map shows the extent of the maximum ice cover on the Great Lakes for each year. Data is from the U.S. National Ice Center and Canadian Ice Service. Satellite data is combined with other sources to translate daily ice charts into a pixel grid of percent cover.
The bar chart shows the maximum total % cover for the Great Lakes basin for each year.